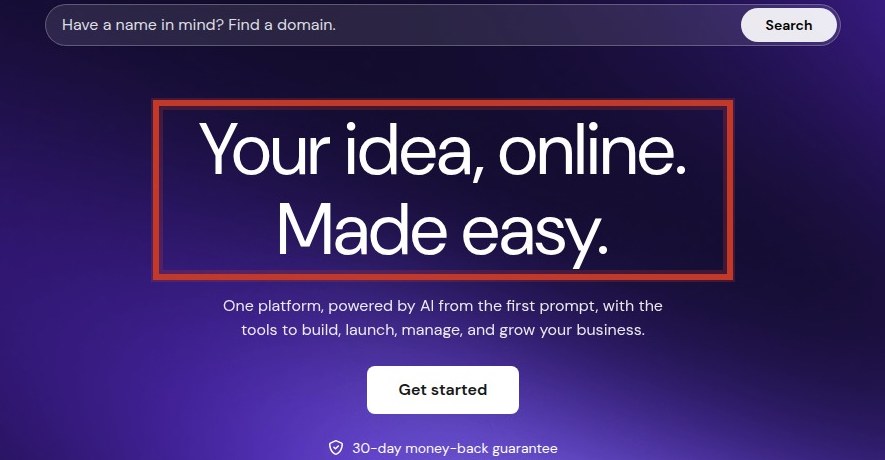
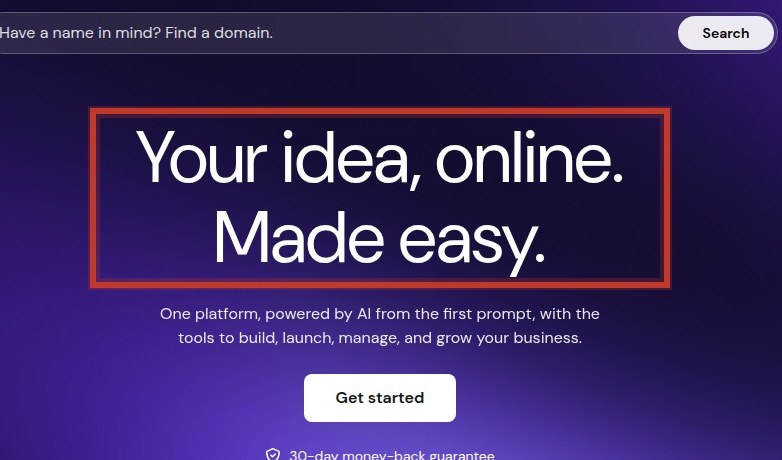
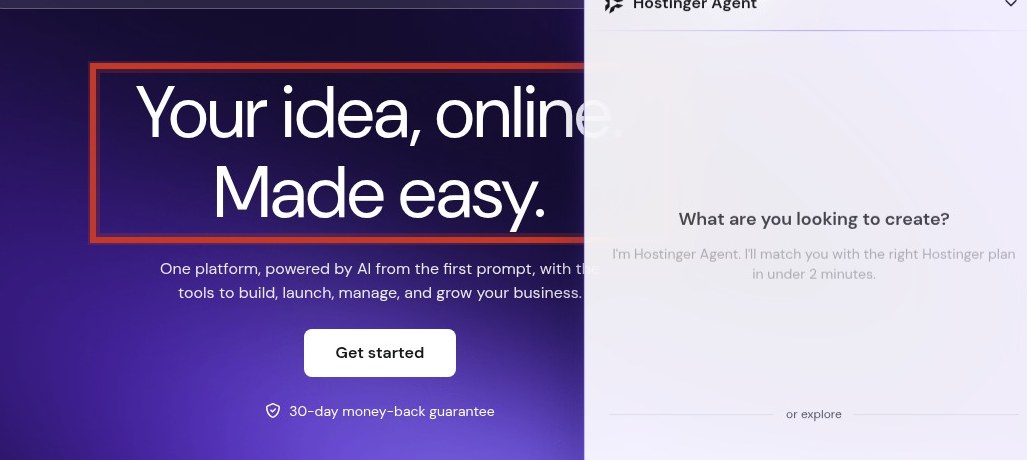
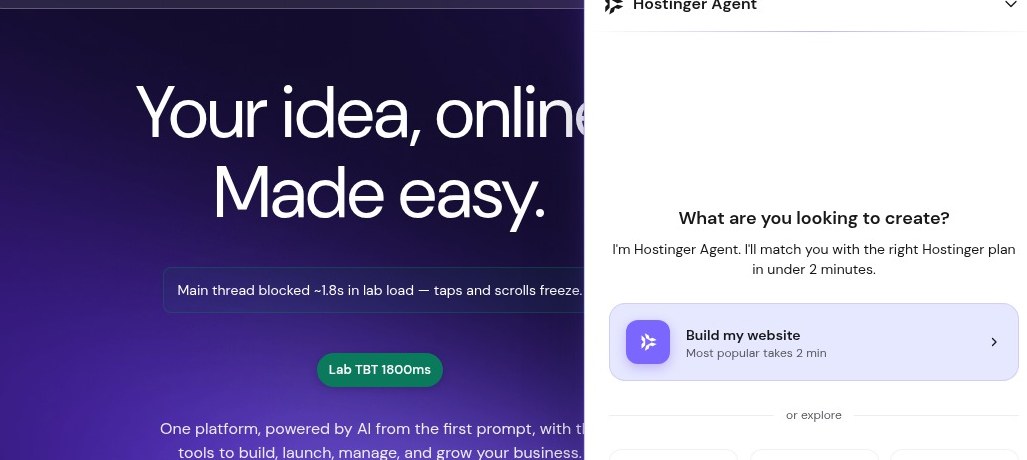
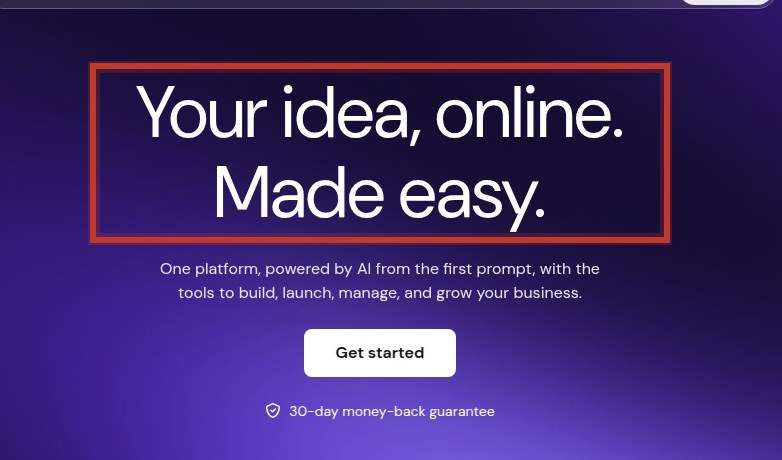
The single most valuable conversion mechanism on this site is the funnel from homepage hero to plan selection, but it is bleeding value because the hero presents multiple competing CTAs that fragment attention, and pricing sections hide the total upfront cost and renewal rates, creating ambiguity and risk at the point of decision.


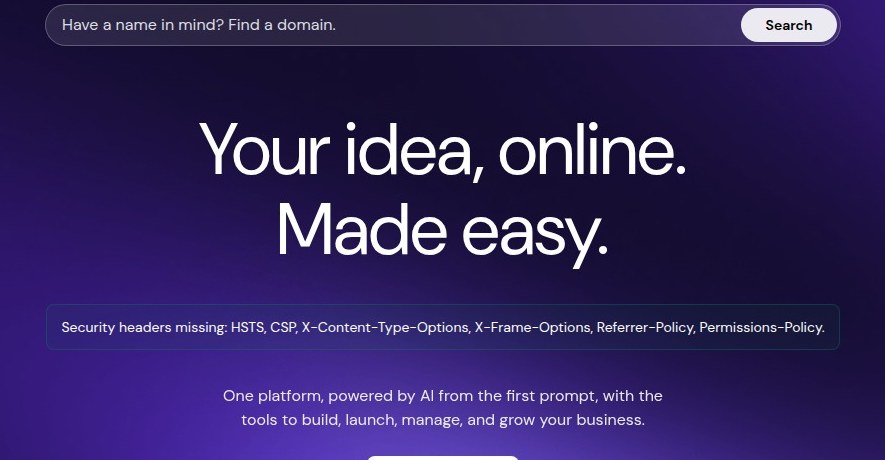
6 of 6 standard security headers are absent, weakening protection against XSS, clickjacking and downgrade attacks.


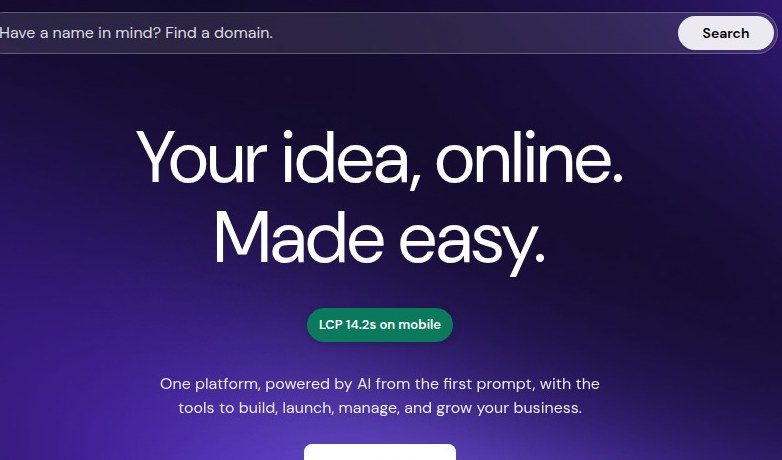
Mobile lab LCP is 14.2s, far above the 2.5s good threshold, causing most visitors to bounce before content appears.


Hero presents multiple unrelated CTAs, fragmenting attention and obscuring the primary action.


Mobile lab TBT is 1800ms, freezing the main thread and making the page unresponsive during load.


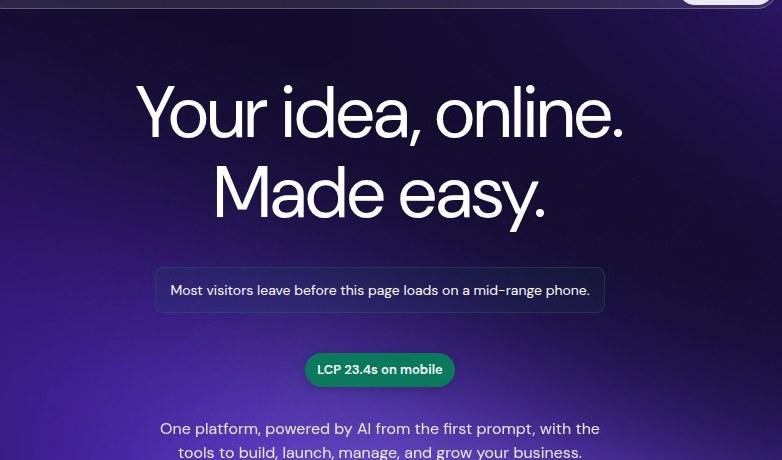
Mobile lab LCP on /website-builder is 23.4s, even worse than homepage, causing extreme bounce risk.


No customer testimonials, review counts, or star ratings are visible on key decision pages despite a 4.7 Trustpilot rating.
Gathered from third-party reviews, forums and video — the site’s own pages are excluded. Every quote was verified word-for-word against the page it links to; anything that could not be verified was discarded rather than paraphrased.
The Premium plan renews at $10.99/month and the Business plan at $16.99/month — both 3 to 4 times the promotional rate, which is the single most common source of buyer complaints.
When Hostinger shows $1.99/month, they mean $95.52 paid upfront today for 48 months of service.
However, its pricing can often seem confusing, as it offers multiple hosting types, various plans, and different subscription lengths.
see this countdown timer yeah completely fake it just resets every time it goes to zero
The cheapest Single plan has no daily backups. If you’re on that tier, you are solely responsible for your own backup strategy. For a beginner who doesn’t know this going in, that risk doesn’t register until something actually breaks.
We were using Hostinger under the assumption that, as a managed hosting provider, they were responsible for securing the server and ensuring
Each surface starts at 100. The worst issue costs its full penalty — Urgent 25, High 12, Medium 5 — and each further issue costs 30% less than the one before, because the fifth problem on a page does not damage it as much as the first.
| Surface | Urgent | High | Score | Grade |
|---|---|---|---|---|
| Performance | 1 | 2 | 61 | D |
| Homepage | 0 | 2 | 84 | B |
| Pricing & Plans | 0 | 2 | 84 | B |
| All Pages (Document Title) | 0 | 1 | 88 | B |
| Site-Wide Security | 0 | 1 | 95 | A |
| Site-Wide Seo | 0 | 1 | 95 | A |
Grades: A 90+, B 80+, C 70+, D 60+, F below 60.
The sum of every finding's individual range. Each row is traffic × conversion × assumed lift band × order value:
| Finding | Lift band | Range |
|---|---|---|
| Missing security headers | 0.5–2.0% | 0.1–0.4/1k |
| Lab LCP 14.2s mobile | 2.0–8.0% | 0.4–1.6/1k |
| Competing CTAs on homepage | 1.0–5.0% | 0.2–1.0/1k |
| Lab TBT 1800ms mobile | 1.0–5.0% | 0.2–1.0/1k |
| Lab LCP 23.4s on /website-builder | 1.0–5.0% | 0.2–1.0/1k |
| Customer reviews absent from decision pages | 0.5–2.0% | 0.1–0.4/1k |
| Weak page metadata | 0.5–2.0% | 0.1–0.4/1k |
| Pricing ambiguity at selection | 1.0–5.0% | 0.2–1.0/1k |
| No visible guarantee or refund signal | 0.5–2.0% | 0.1–0.4/1k |
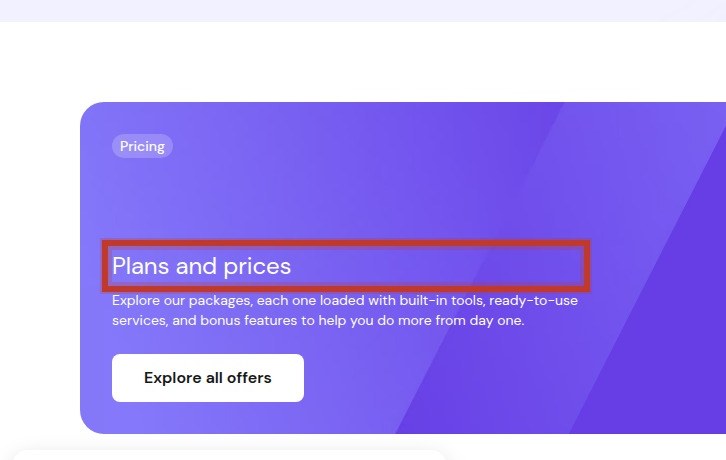
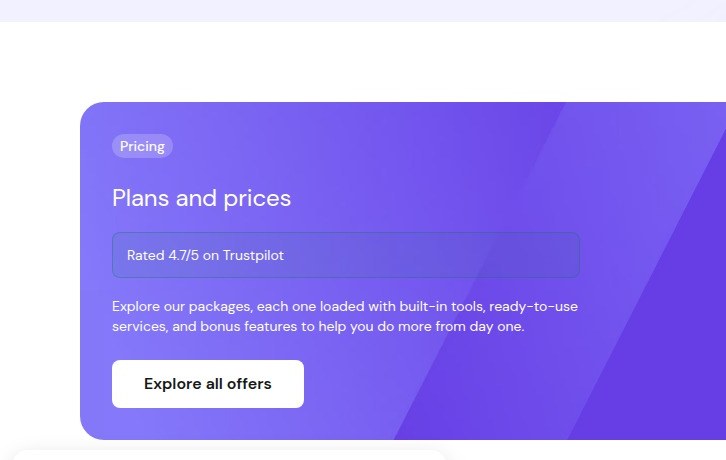
| Trustpilot widget mislabeled as title | 1.0–5.0% | 0.2–1.0/1k |
No traffic or order-value figures were supplied, so the total is a per-1,000-visitor rate against an assumed 2% baseline. Supply real figures and this becomes a dollar range.
Caveat that applies to every row: Across 127,000 experiments, 12% produced a statistically significant improvement on the primary metric; a healthy programme win rate is 10-30%. These are prizes if changes work, not forecasts.
A verified finding was measured directly — real-user field data, security headers, accessibility defects counted in the markup — and is reproducible by anyone. Everything else is expert inspection: valuable, but a hypothesis until tested.