1
Urgent
Performance
Verified by measurement
LCP 12.2s on news
Lab LCP on /en-us/news is 12.2s, far above the 2.5s good threshold, causing most mobile visitors to bounce before content appears.
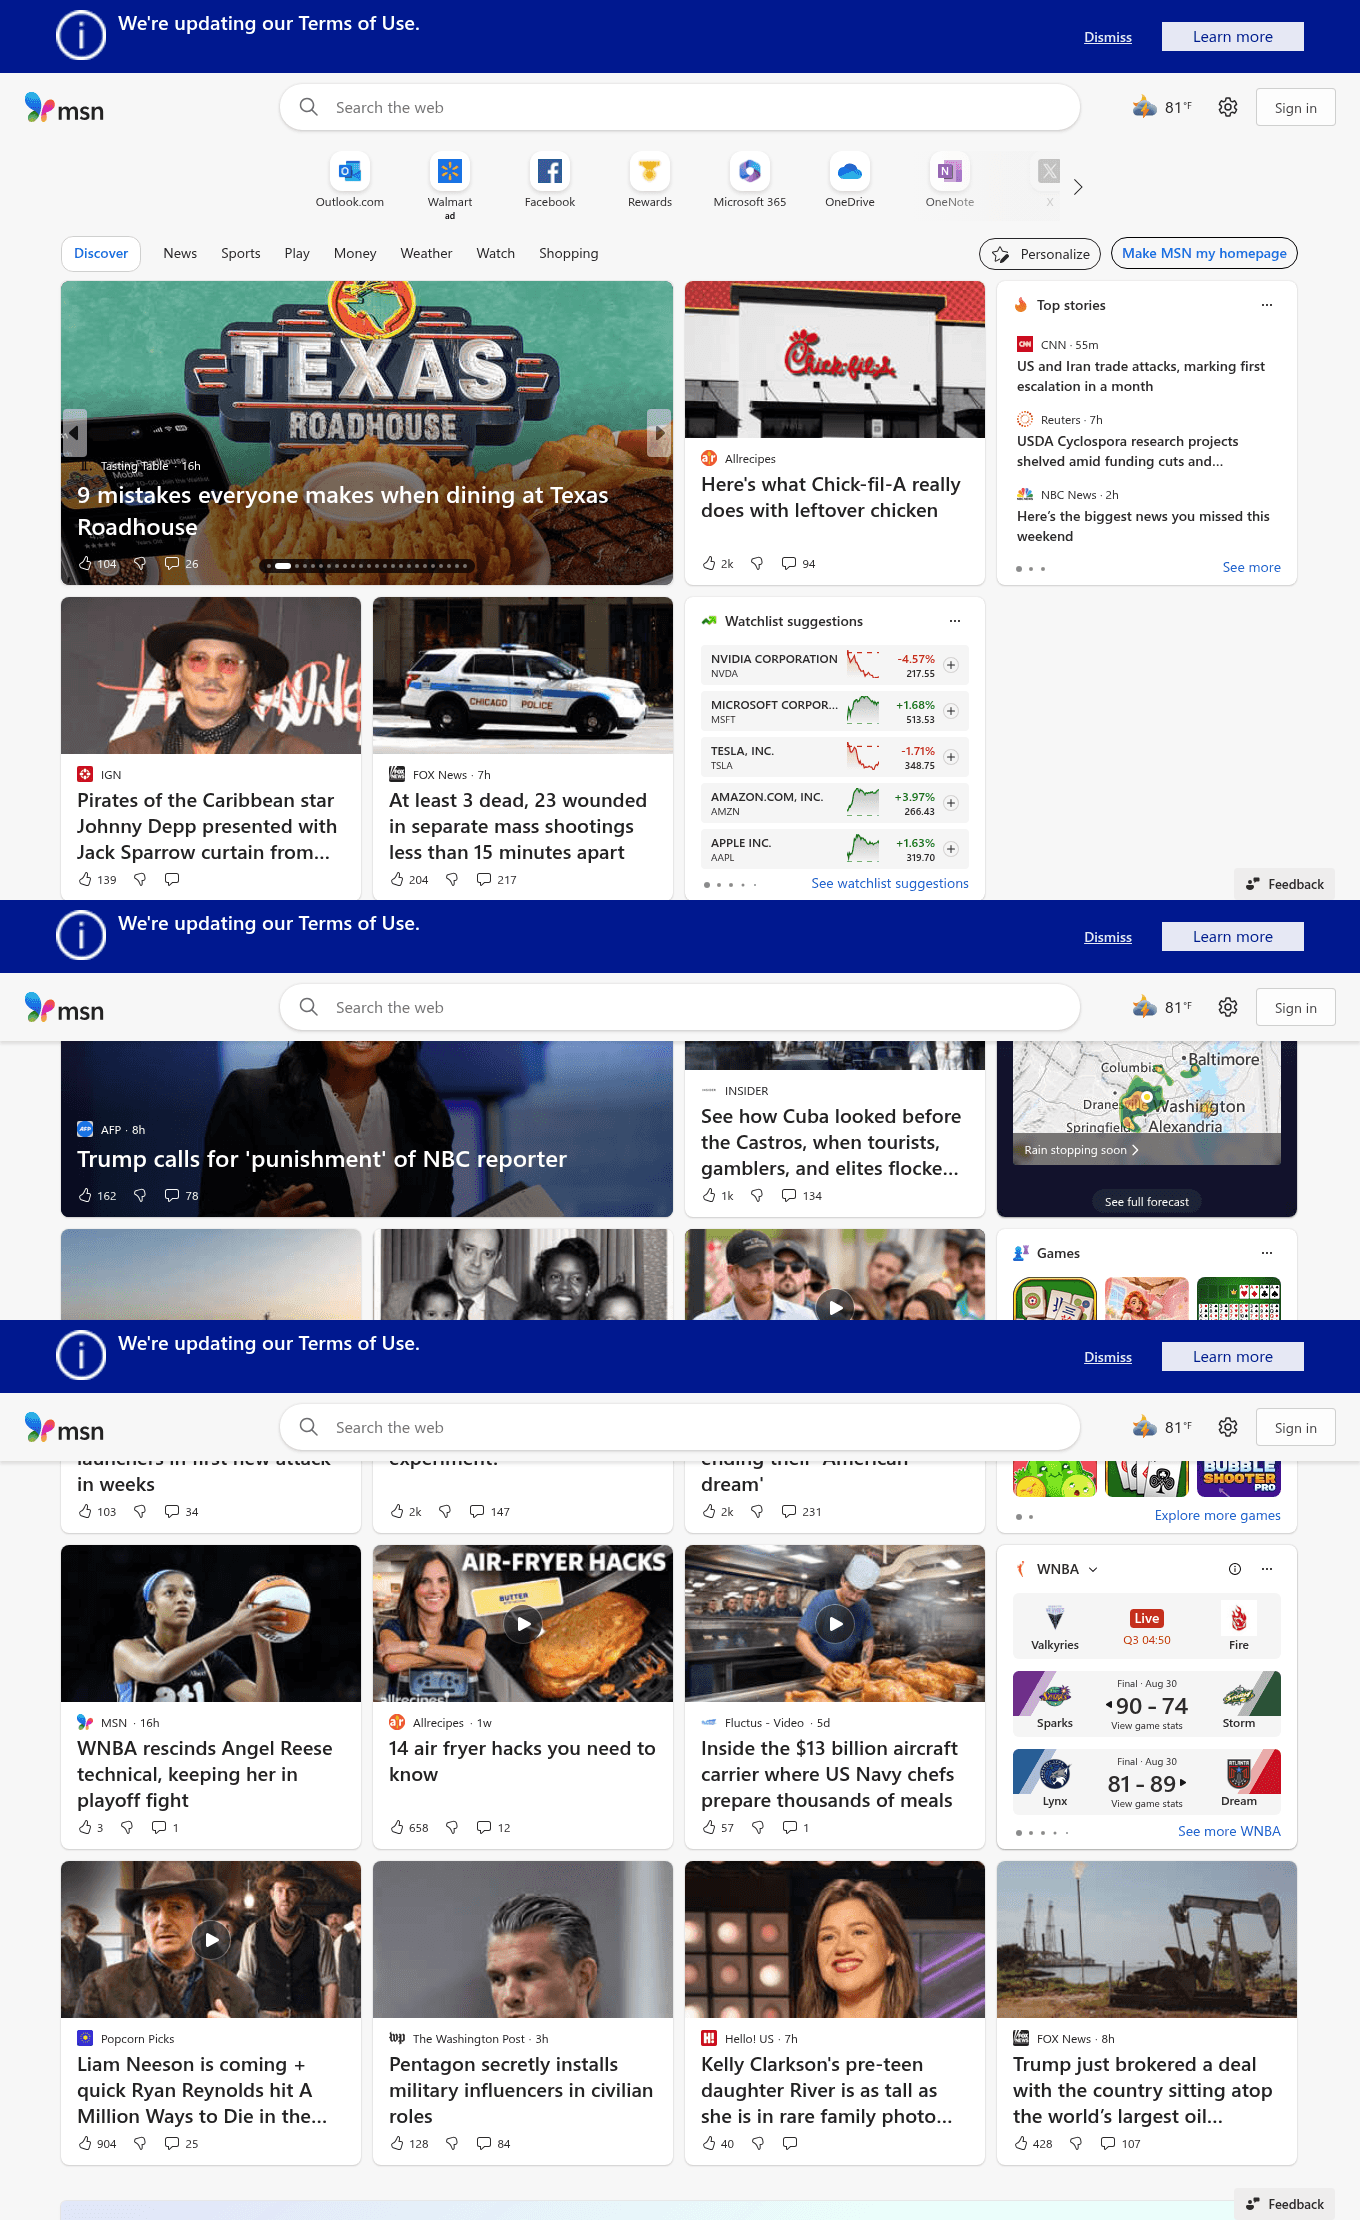
scroll ↕ — this is the live page
⚠ LCP 12.2s on newsThe page's largest content element, the news headline, takes 12.2 seconds to paint on a mid-range phone. This is far above the 2.5-second 'good' …
Preload hero imageDefer non-critical JSInline critical CSSUse WebP images
News
Latest News
Stories load in under 2.5s.
✓ Fast loadMain content appears in under 2.5s on mobile.
FixOptimize the critical rendering path by deferring non-critical JavaScript and inlining essential CSS. Preload the hero image and use modern formats like WebP with proper dimensions. Implement lazy loading for below-the-fold content to prioritize the main headline. These changes should bring LCP under 2.5 seconds, keeping visitors engaged.
Evidence
Observed on the live site Verified by measurement
✓ Flagged independently by 1 of 7 analysts
- Lighthouse (mobile emulation, single synthetic run via DataForSEO): Largest Contentful Paint 12.2 s against a ‘good’ threshold of 2500ms. Lab data, not real-user field data — confirms the defect class, not the field percentile.
Business case
If this change wins
0 – 0
orders per 1,000 visitors
Medium
Effort — 2-5 days
Not A/B testable
At typical traffic
Detecting this needs about 124,891 visitors per variant. Ship it as a sequenced change and log the date instead.
Prioritisation
PXL score: 5 / 10
Assessed from the live page
| Question | Answer | Points |
|---|---|---|
| Is the change above the fold? | Yes | 1 |
| Is the change noticeable in under 5 seconds? | Yes | 2 |
| Does it add or remove an element? | Yes | 1 |
| Does it run on a high-traffic page? | No | 0 |
| Verified by direct technical measurement? | Yes | 1 |
Criteria that need your data
4 of these could not be answered from the live page. Session recordings, survey or support themes, and analytics access would raise the confidence of this ranking — they do not indicate a weaker finding.
| Question | Answer | Points |
|---|---|---|
| Discovered via user testing? | No | 0 |
| Discovered via qualitative feedback (survey, support)? | No | 0 |
| Supported by heatmaps or session recordings? | No | 0 |
| Found via digital analytics or real-user field data? | No | 0 |
Implementation
Hand this to your developer
- Surface
- Performance — PERFORMANCE
- Problem
- Lab LCP on /en-us/news is 12.2s, far above the 2.5s good threshold, causing most mobile visitors to bounce before content appears.
- Current state
- notes: Largest Contentful Paint 12.2 s (lab, mobile on /en-us/news)
- Change
- notes: Largest Contentful Paint ≤ 2500ms (good)
- Acceptance criteria
- GIVEN a first-time visitor on the affected page
WHEN the change is live
THEN Largest Contentful Paint ≤ 2500ms (good), with no regression at 375px and 1280px widths. - Tracking
- event: cro_lcp_12_2s_on_news on interaction with the changed element; verify it fires in BOTH variants before opening traffic.
- Success metric
- conversion rate on the affected step
- QA checklist
- Chrome / Safari / Firefox · 375px + 1280px · keyboard reachable · screen-reader name present · no CLS introduced
- Effort
- Medium — 2-5 days
- Test plan
- 124,891 visitors per variant (95% significance, 80% power); 37 days.
- Rollback
- Feature-flag the change; revert the flag if the primary metric drops for 3 consecutive days.