2
Urgent
Performance
Verified by measurement
TBT 1,890ms on NBA
Lab TBT on /en-us/sports/nba is 1,890ms, blocking main thread interactivity for nearly 2 seconds, causing taps and scrolls to freeze.
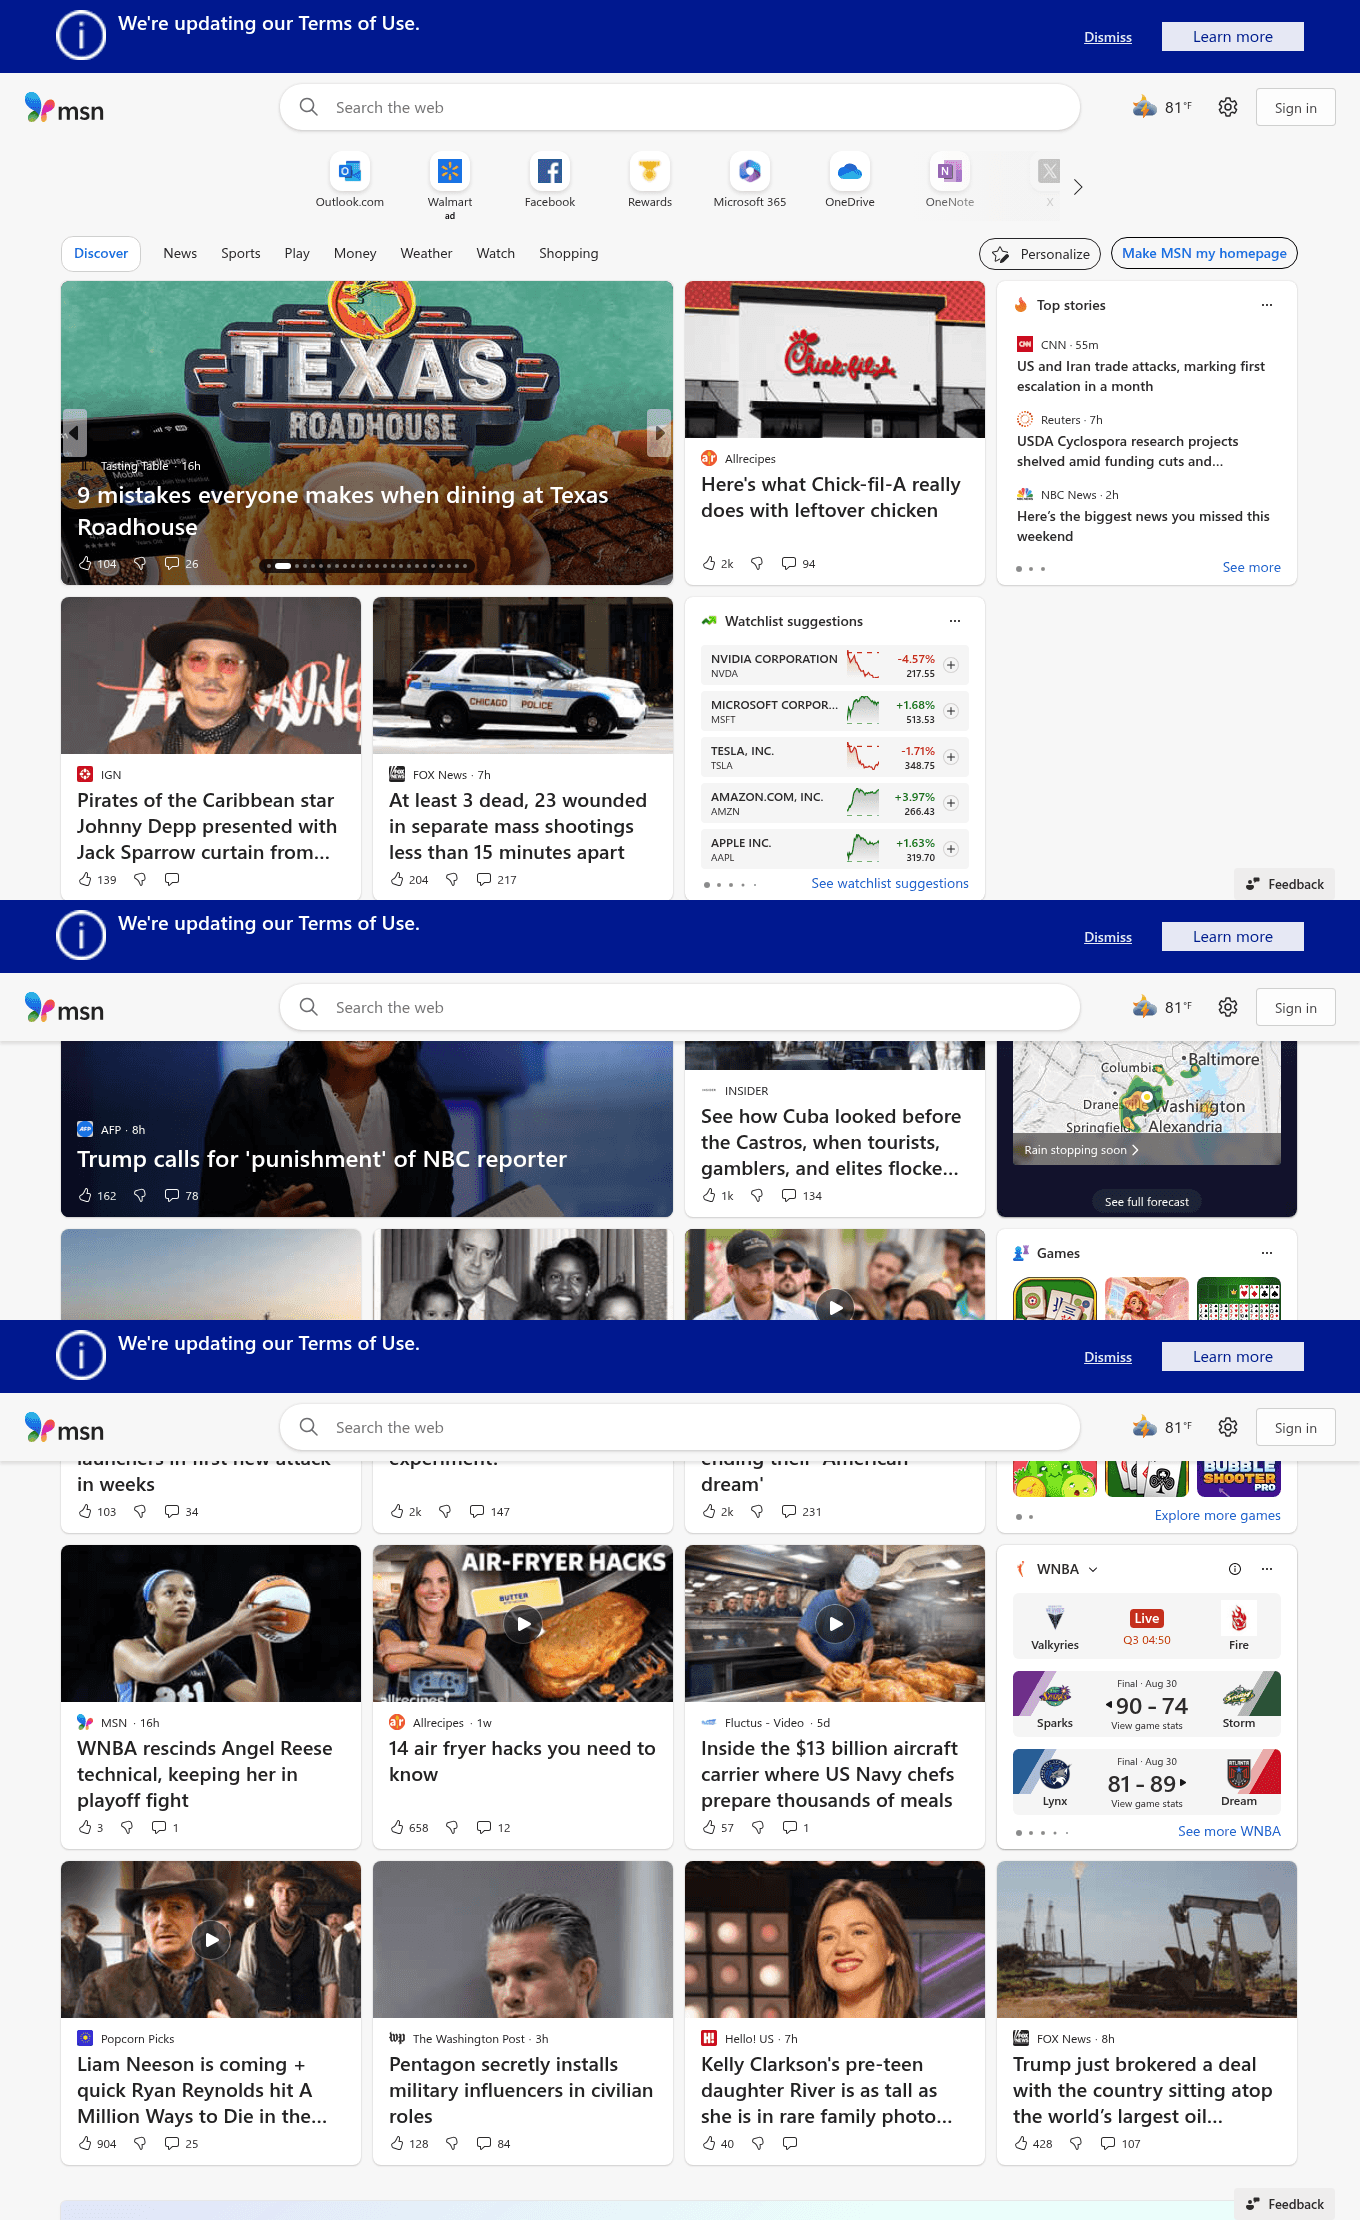
scroll ↕ — this is the live page
⚠ TBT 1,890ms on NBAThe page's Total Blocking Time (TBT) is 1,890ms, meaning the main thread is blocked for nearly two seconds during load. This prevents the browser …
Reduce TBT to ≤200msOptimize script executionDefer non-critical JS
NBA Scores & Schedule
NBA
Live scores, schedules, and news for the NBA season.
$0.00
Get Started✓ Instant responsePage becomes interactive in under 200ms; taps and scrolls respond immediately.
FixReduce Total Blocking Time to under 200ms by breaking up long tasks, deferring non-critical scripts, and optimizing third-party code. Implement code splitting to load only necessary JavaScript for the initial view, and use web workers for heavy computations. This will allow the page to become interactive quickly, improving user experience and conversion rates.
Evidence
Observed on the live site Verified by measurement
✓ Flagged independently by 1 of 7 analysts
- Lighthouse (mobile emulation, single synthetic run via DataForSEO): Total Blocking Time 1,890 ms against a ‘good’ threshold of 200ms. Lab data, not real-user field data — confirms the defect class, not the field percentile.
Business case
If this change wins
0 – 0
orders per 1,000 visitors
Medium
Effort — 2-5 days
Not A/B testable
At typical traffic
Detecting this needs about 124,891 visitors per variant. Ship it as a sequenced change and log the date instead.
Prioritisation
PXL score: 5 / 10
Assessed from the live page
| Question | Answer | Points |
|---|---|---|
| Is the change above the fold? | Yes | 1 |
| Is the change noticeable in under 5 seconds? | Yes | 2 |
| Does it add or remove an element? | Yes | 1 |
| Does it run on a high-traffic page? | No | 0 |
| Verified by direct technical measurement? | Yes | 1 |
Criteria that need your data
4 of these could not be answered from the live page. Session recordings, survey or support themes, and analytics access would raise the confidence of this ranking — they do not indicate a weaker finding.
| Question | Answer | Points |
|---|---|---|
| Discovered via user testing? | No | 0 |
| Discovered via qualitative feedback (survey, support)? | No | 0 |
| Supported by heatmaps or session recordings? | No | 0 |
| Found via digital analytics or real-user field data? | No | 0 |
Implementation
Hand this to your developer
- Surface
- Performance — PERFORMANCE
- Problem
- Lab TBT on /en-us/sports/nba is 1,890ms, blocking main thread interactivity for nearly 2 seconds, causing taps and scrolls to freeze.
- Current state
- notes: Total Blocking Time 1,890 ms (lab, mobile on /en-us/sports/nba)
- Change
- notes: Total Blocking Time ≤ 200ms (good)
- Acceptance criteria
- GIVEN a first-time visitor on the affected page
WHEN the change is live
THEN Total Blocking Time ≤ 200ms (good), with no regression at 375px and 1280px widths. - Tracking
- event: cro_tbt_1890ms_on_nba on interaction with the changed element; verify it fires in BOTH variants before opening traffic.
- Success metric
- conversion rate on the affected step
- QA checklist
- Chrome / Safari / Firefox · 375px + 1280px · keyboard reachable · screen-reader name present · no CLS introduced
- Effort
- Medium — 2-5 days
- Test plan
- 124,891 visitors per variant (95% significance, 80% power); 25 days.
- Rollback
- Feature-flag the change; revert the flag if the primary metric drops for 3 consecutive days.